How I Mapped Bikelanes Around the World
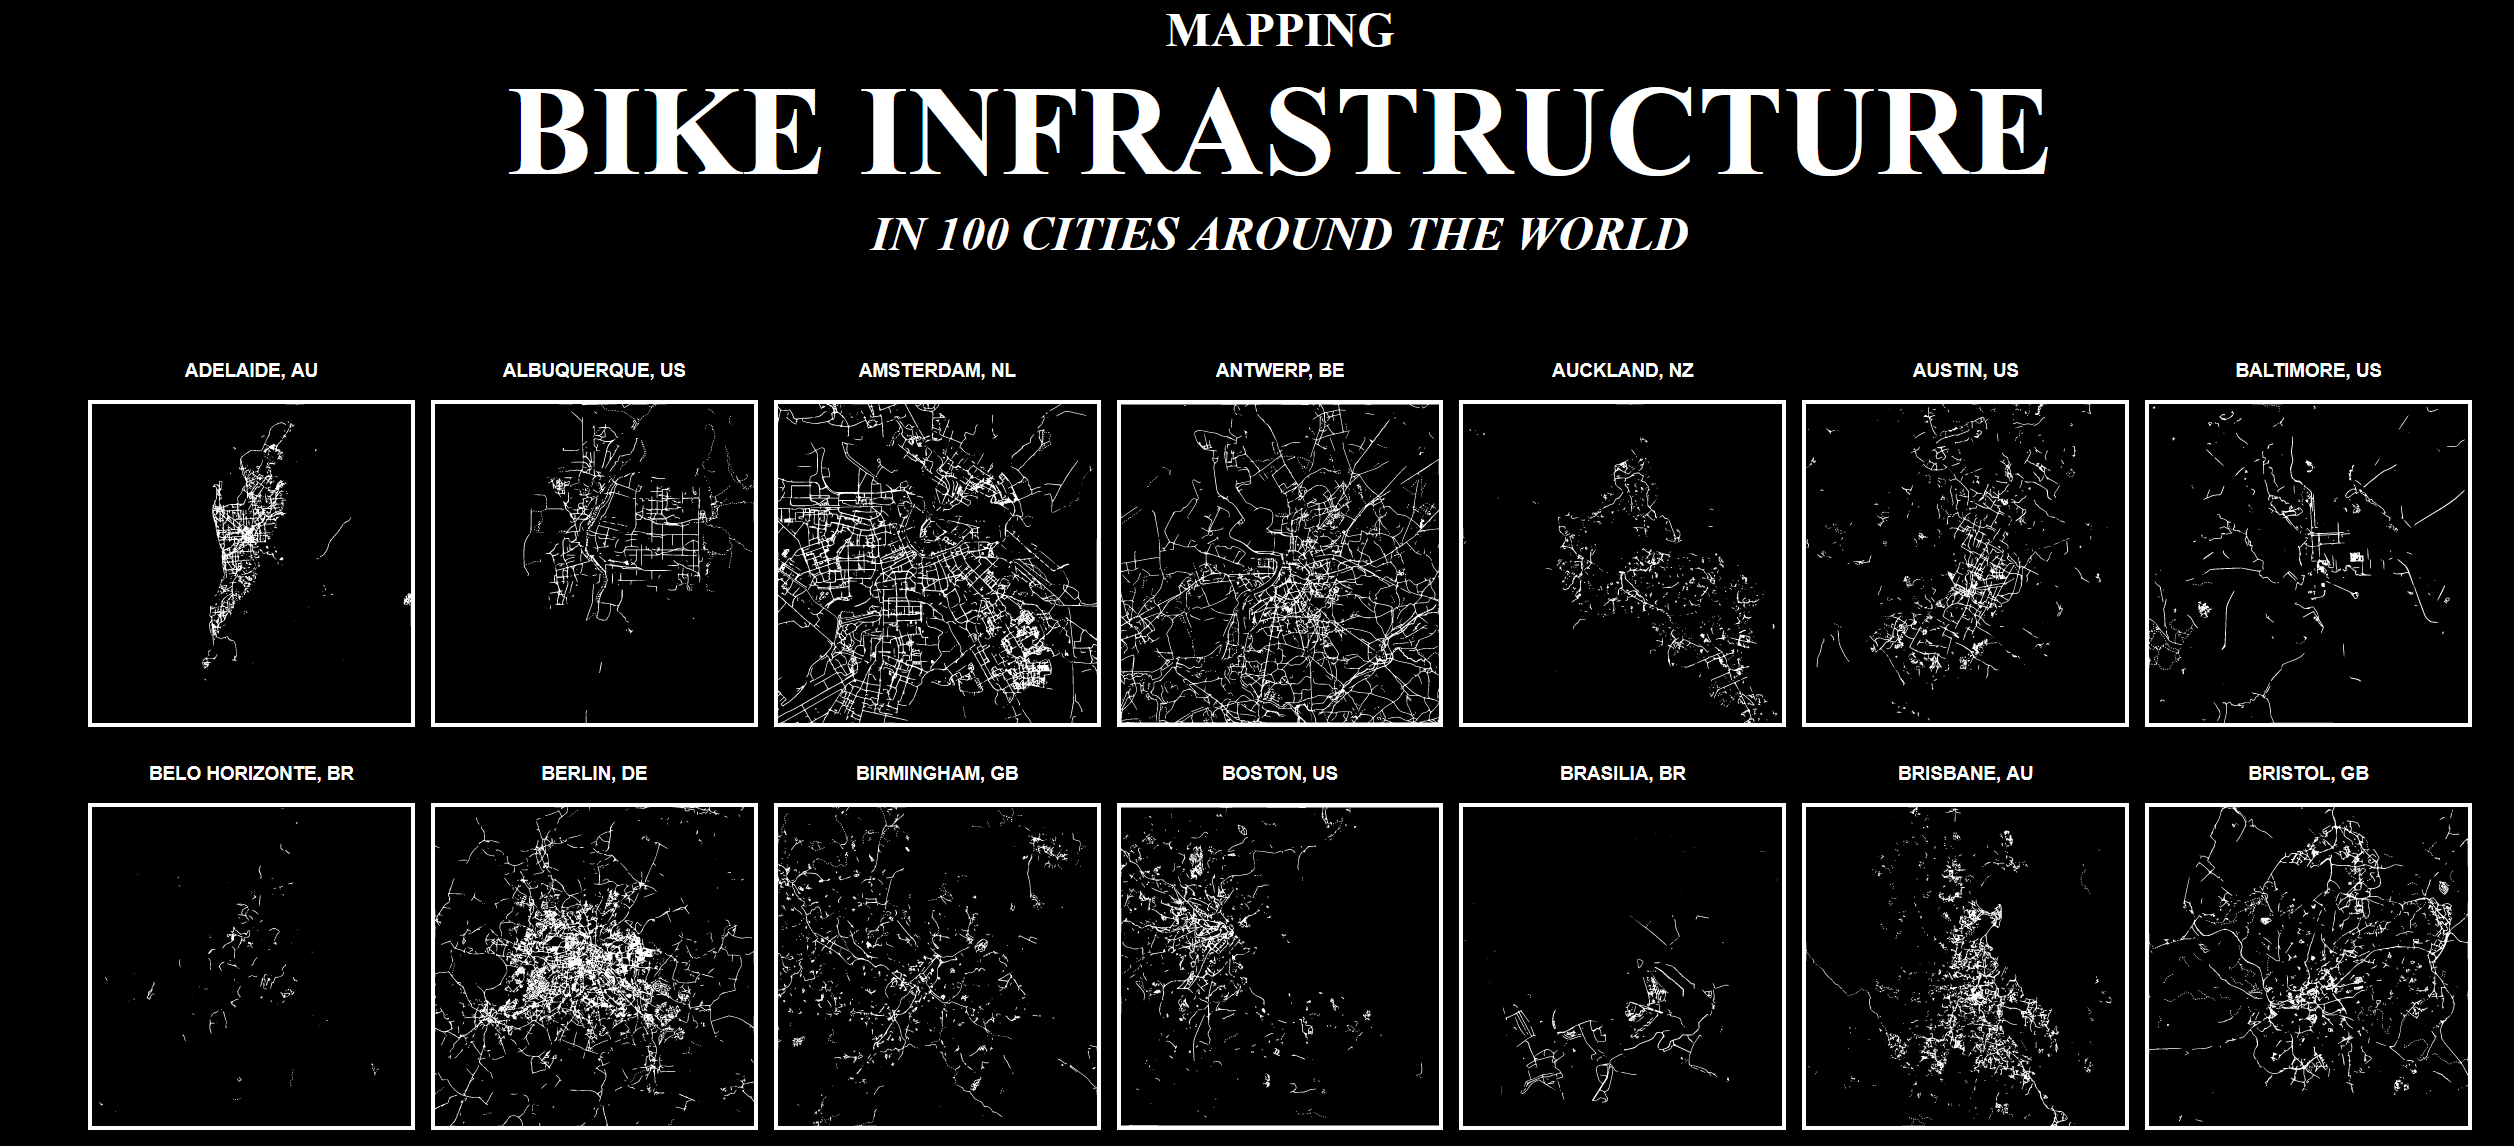
I have some very exciting news! I've been collaborating with rapsoj to work on a project mapping bikelines around the world. You can see the completed results right here on my blog. Each map shows just the bike infrastructure as taken directly from Google Maps, to try to get an idea of bikable the city is. The cities chosen represent the cities in the world with a population of over 500k that also have data available on Google Maps.
I'm very excited about finishing this project because this is the first step to being a more creative and prolific writer and researcher. As I once wrote, I feel like it's important to always be creative, even in small ways, and I'm happy to be able to publish something that is a little bit more than small. I've also always wanted to be able to contribute to the areas and projects that I care about, and alot of the inspiration behind this project was from me, as a cyclist, wanting to create something I personally would find interesting. Being able to visualize the bike infrastructure in other cities is useful because I wanted to see how Toronto was faring on a global level, and also because it gives me ideas for places to travel to if I want to experience other bikeable cities. I hope others will be able to find it as cool as I do.
Originally this was going to be more of a research project, where various metrics would be calculated and compared to more scientifically assess different cities' bike infrastructure. However this type of work is not new, and many of nonprofit organizations are already doing similar things with more detailed data and better (by which I mean nonzero) funding. We decided that the biggest impact we could make would be by focusing on the advocacy side; creating something artistic that can be looked at and shared to generate some interest from people who may not know about bike infrastructure disparity throughout the world. I don't expect it to go viral or anything, but it's already gotten a few dozen comments on Reddit, and even one would be more than enough in my opinion.
How the map is made
When creating this project, my role was to do the scripting that would download the data, process it, and then put it all together in that nice pretty webpage. Because rapsoj has already written a post talking about the background and some of the uses of a project like this, I'll discuss how we actually accomplished this. I'll start with a general overview, and include a more technical section below.
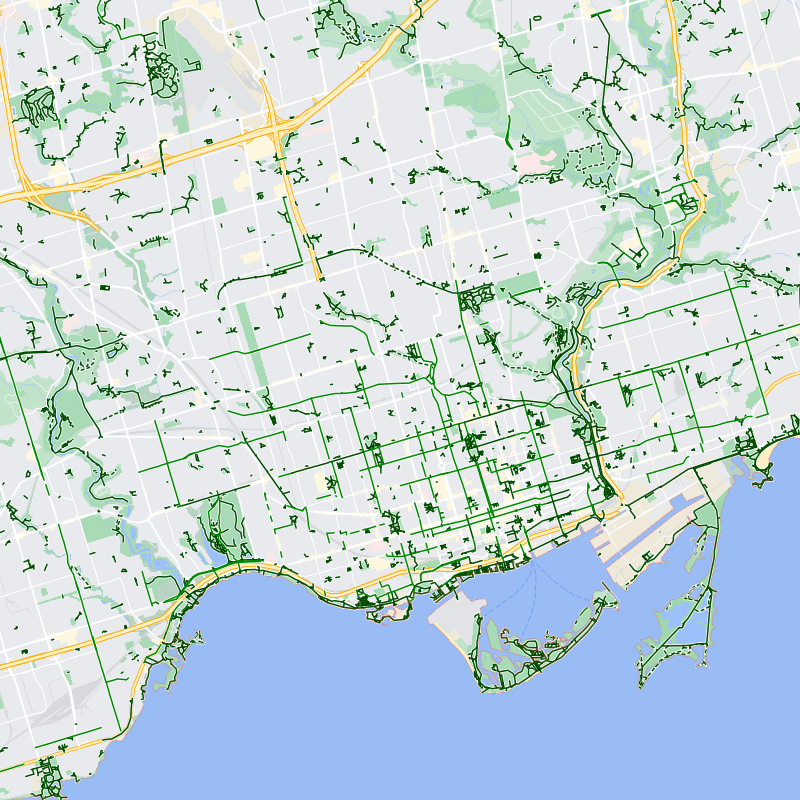
The first question we had was how to acquire bike lane data for so many cities from a single, easy source. There are many similar projects to do so, but many of them have gaps in the data or use painstakingly manual techniques like going over Google Street View imagery to see the bikelanes. We decided that overall, the most reliable source of the data would be from Google Maps itself since it works all over the world and it's data is crowdsourced so there's millions of people around the world contributing to making it accurate. Unfortunately, I quickly discovered that the Google Maps API doesn't actually let you download the bike lane data itself, it only lets you display it on top of a map. I don't know if this is an oversight or intentional, but it meant that my options were either reverse engineering the Google Maps data to try to extract the bike data from there, or to just use pictures.
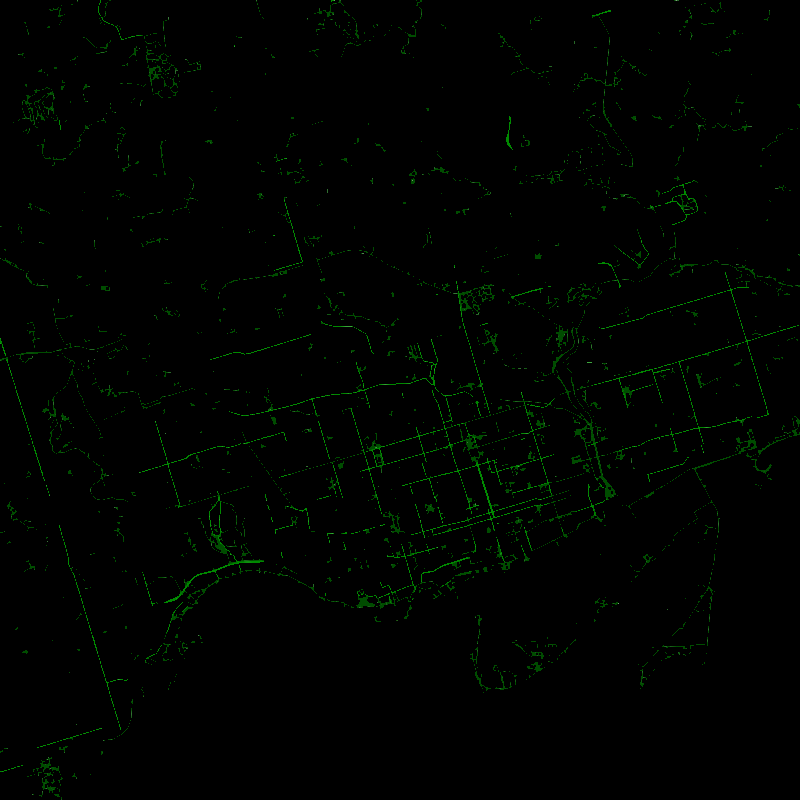
Despite my best attempts, I ended up going with the second option since it was relatively straightforward. Since the API was hard to use, the easiest method was to automatically open Google Maps in a web browser, search for the location, and take a screenshot. From there, since all the bike lanes are the exact same hue of green, I was able to filter them out of the screenshot and into a separate black and white image. Finally, I just compiled all the images into a single, pretty looking page for people to look at and put it here. One big downside of this method is that even though Google Maps does try to differentiate different types of bikelanes with colors and dotted lines, it was hard to preserve that data after filtering the colors out. That's why, on the maps, cities with relatively unsafe bike infrastructure like San Diego may look better than they are.
At the very beginning I was hoping to do complex analyses like maybe the percentage of the city with 15 mins of a bike lane, or the area of the city reachable by a bike. Unfortunately, due to this data format, that ended up being much harder than anticipated and that's why we pivoted to a more artistic project. In the future, I'd like to be able to separate the different types of bike infrastructure so that we can visualize only the protected lines, or only the bike trails. Unfortunately, even Google Maps is somewhat inconsistent on that front (it has different shades of green, but seems to color an unprotected and protected bike lane the same) so we'd need to find a different data source. Overall though, I'm happy with how this turned out.
If you'd like a more technical explanation of my process, take a look at the :technical nitty gritty.
:x Technical
So, you've dared to venture into the technical nitty gritty. Maybe you're hoping to get a better a understanding of the guts of the project, or perhaps you just like me and want to read more of anything I write. If it's the second option, I hope I don't bore you too much but let's dive in. Also, the code is available on github, but it's extremely messy and hard to use (and potentially broken). If you're interested in learning more about it, feel free to reach out and I'd be happy to help.
As I mentioned, when I started the project I really wanted to use the actual Google Maps API instead of having to scrape the site. The API would have numerous advantages: being much faster than opening a link for every location, more accurate than just filtering out the bike lanes from an image, and theoretically easier to use. However I was really surprised when there was no way to use the API to get the data I needed.
Since the API did send an JS object with the bike lanes drawn as a layer on top, I figured it must be possible to dig through the object and find the actual raw bike lane data somewhere. I spent a few hours looking into this, mainly by clicking on random parts of it in the debugger and blindly groping for anything that had a familiar name. Eventually, I concluded it was unfeasible and that the Google Maps data format is a little beyond me and transitioned to scraping the actual webpages.
To find the Maps page for a specific location, I found a URL that would search for a location and open it with the bike lane layer enabled. Then, I was able to use Selenium with Python to open the URL, click the right buttons to turn off all the labels, take a screenshot, and crop it to just contain the map. This part was surprisingly difficult since the site often took a while to load or loaded in a weird order which broke Selenium so I needed to have lots of try and wait. This was also by far the slowest part of the process since for every location I had to open a new browser and wait for the entire page to load. It worked though, and I then had a collection of cropped screenshots of maps with bike lanes.
Then, to filter out just the bike lanes, I used openCV to extract just the green. I discovered that even though multiple shades of green were used to denote different types of bike lanes, in the HSV color space they all had the exact same hue and varied mainly the saturation. With some trial and error to keep green spaces from being filtered, I now had a mask of exactly where the bike lanes were in the original image. For some reason, likely due to blurring somewhere, this was a little messy and contained some white at the edges so I applied the erode operation from openCV to get just the green bike lanes. This part was also quite experimental, and I tried various image transformations like blurring and dilation but I'm quite happy I eventually landed on image erosion to get exactly what I wanted.
At this point, we were almost done and decided that outputting the final images in svg format would look the nicest, so you can zoom into each one without any loss in quality. However, this turned out to be surprisingly difficult. There is no simple python library to convert images to svg format, and with more research I discovered that unlike other image conversions like png to jpg or png to tif there is no canonical way to get the svg version of a png image. If you'd like to go down a little rabbit hole about why, :feel free.
However, what this meant for us is that we had to use an external program called potrace to do the svg conversion. First, we had to make an image in pbm format (which I'd never heard of before now), which only contains 1s and 0s for bright and dark spots; no colors or shades. Luckily, since I had the mask this wasn't too difficult, but it was the only way that potrace would do the conversion to svg format. This does mean that to run this, you need to have potrace installed on the command line for Python to call it. I did play with the parameters a little bit to make the image nicer to look at, since this is supposed to be somewhat artistic after all, and finally got something I was happy with.

Finally, we had a good quality svg formatted image for each location. To make it presentable, we put it all in a nice webpage that anybody can access. We used a CSS grid which is quite nice since you can zoom in as much as you want, and since the images are svgs they won't lose quality. Overall it was quite roller coaster but I'm reasonably happy with the technical decisions I made to get here. Running it for 100 cities does take about half an hour because the web scraping is a little slow, but you only have to do it once so I don't mind too much. I'm just glad I got the experience with these tools that I did.
:x svg
Unlike png, jpg, and tif which are all basically raster image formats, svg is a vector image format. This means that instead of storing the exact pixels, it stores a set of instructions to recreate the image out of lines, strokes, and curves. This is why you can zoom in infinitely and not lose any quality, but it's also why there's no simple way to convert between formats.
Since there could be many different instructions to create the same image, there's not a single svg that can be made from each png. I spent some time trying to use openCV to trace the contours of the bikelanes and then somewhat manually create a set of instructions from that to build the svg, but unfortunately that didn't quite work.
Work outside a job
One thing I've been struggling with lately is how much importance to place on a job and how much to place on personal projects. Doing a job you like that aligns with your goals is nice, but these kind of jobs tend to pay less and are harder to find. Even if I could find a job doing these kind of projects full time, I'd almost certainly make less than if I were optimizing parasitic ad algorithms. I also think doing this kind of stuff as a job would be more fun, but maybe not quite as interesting as doing at my own time and my own pace. I don't mind doing these projects outside of work and on my own time, as long as I have the time and motivation to do these things after work is done. If I do have a higher paying job, I can fund more expensive projects and adventures that I might not other get to experience.
The question, put succinctly, is how much of my time should I sell for money, and how much time do I need to pursue interesting projects of my own. I'm very happy about completing this because it proves that I'm able to independently complete worthwhile projects without the guidance of a job or the motivation of money. I'll be much more comfortable taking a busier and higher paying job, being in it mainly for the money as some might say, as long as it doesn't sap me of the motivation I need to work towards other goals I have. Having both motivation to create and money to fund it with would be an ideal scenario for me, as it opens up a whole new world of possible projects. For this project it wouldn't make much of a difference, but there are some datasets or resources I'd only have access to if I was willing to spend a little bit.
Ultimately, I'm kind of taking a gamble that having a busy job with 40 hours a week of work won't inhibit me from continuing to do interesting work when I get home. I'm happy that completing this has given me a little more hope about that gamble paying off. I'm optimistic that I'll be able to deliver future projects to you, dear reader. Maybe not very frequently, but I plan on keeping up this momentum and working on cool and fun things in my free time as much as I can.